Lesson 3 — Workflow Mapping Fundamentals
Unit 3 | Lesson 3 of 3
By the end of this lesson, you will be able to:
- Explain what a workflow map is and why it is the foundation of AI solution design
- Use standard workflow notation to represent triggers, steps, decision points, swim lanes, and outputs
- Distinguish between process mapping and value stream mapping, and explain when each is appropriate
- Distinguish between a current-state map and a future-state map, and explain why the former must come first
- Select an appropriate mapping tool for your context and use AI assistance to accelerate the mapping process
- Produce a current-state workflow map of a candidate process from your own organisation
What a workflow map is — and why it matters
A workflow map is a structured visual representation of a process: every step in order, who is responsible for each one, what information is needed at each stage, and where decisions are made. It is the document that makes a process visible in a way that a written description alone cannot achieve.
In the context of AI solution design, a workflow map serves several distinct purposes. It forces precision — you cannot draw a step you cannot describe, which means the act of mapping often reveals gaps, ambiguities, and undocumented assumptions that nobody had noticed before. It creates a shared reference point for everyone involved in designing, approving, or implementing the solution, from the automation practitioner to the IT team to the senior stakeholder who needs to sign it off. Critically, it provides the baseline against which a future state can be designed and evaluated.
You cannot design a good AI-enabled workflow without first understanding the current state in detail. A future-state map that skips this step tends to automate an idealised version of the process — one that does not account for the exceptions, the legacy data, the approval chains, or the informal workarounds that characterise how the work actually gets done. Those details only surface when you map carefully, and ignoring them is one of the most common reasons automation projects fail to deliver their expected value.
Standard notation
Workflow maps use a consistent visual language so that anyone familiar with the notation can read a map they have never seen before. The core elements are straightforward.
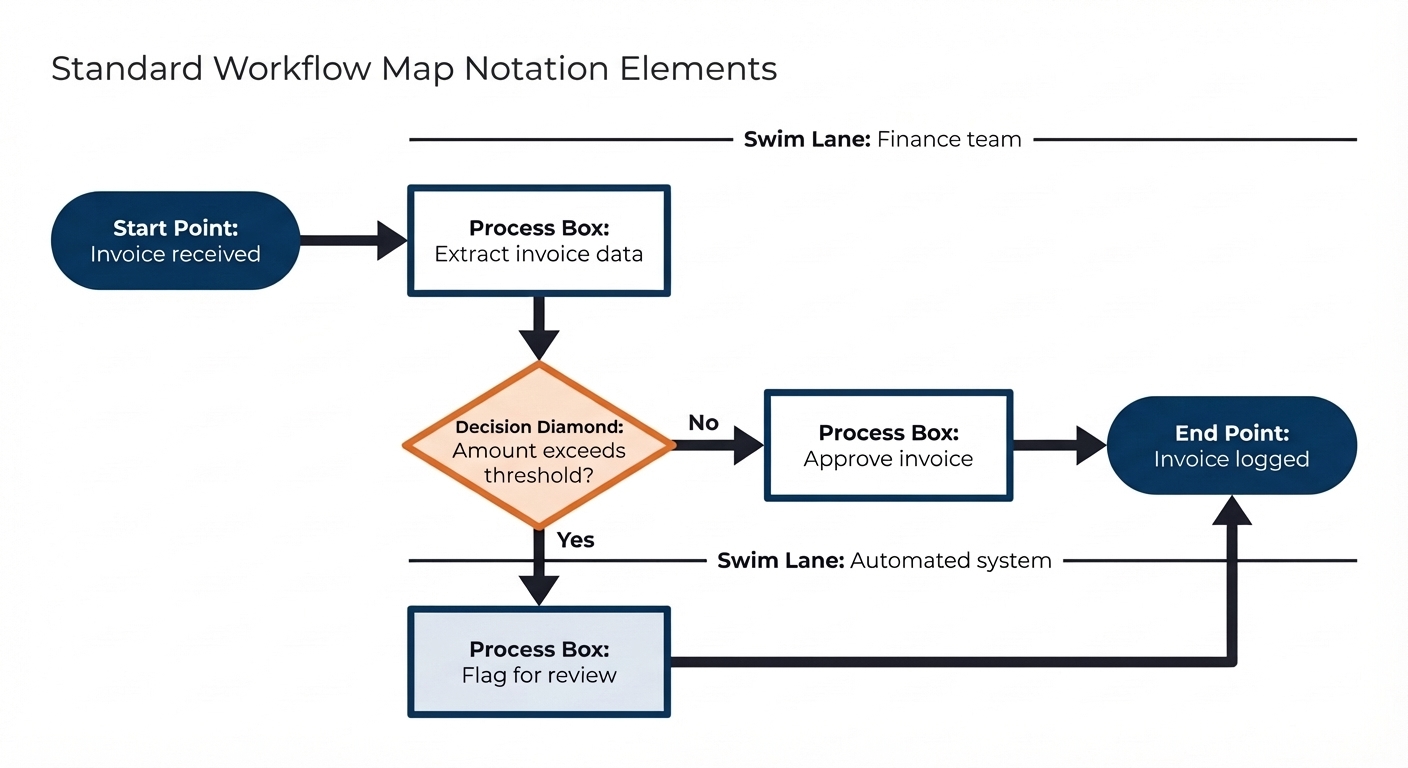
Process boxes represent actions or tasks — something being done by someone. They are drawn as rectangles and labelled with an active verb phrase: "Extract invoice data," "Send confirmation email," "Review application." Each box represents a single, describable action.
Decision diamonds represent points in the process where a condition is evaluated and the next step depends on the outcome. They are drawn as diamonds and labelled with a yes/no question or a condition: "Amount exceeds threshold?", "All fields complete?", "Escalation required?" Each exit from the diamond is labelled with the condition that leads down that path.
Arrows show the direction of flow between elements — from trigger to first step, from step to step, from decision diamond to the next action on each branch.
Swim lanes are horizontal or vertical bands, each representing a different actor — a person, a team, a system, or an automated component. Steps are placed in the swim lane of whoever or whatever is responsible for performing them. Swim lanes make handovers between people and systems immediately visible, which is particularly useful when designing AI solutions because the handover points are often where the human-in-the-loop moments sit.
Start and end points are drawn as rounded rectangles or filled circles and mark the boundaries of the process: what triggers it and what constitutes completion.
Current-state versus future-state mapping
There are two types of workflow map you will produce over the course of this programme. The current-state map — sometimes called an "as-is" map — documents the process exactly as it works today, including its inefficiencies, workarounds, manual steps, and exception paths. The future-state map — sometimes called a "to-be" map — documents how the process will work after the solution has been implemented.
The current-state map always comes first. This is not procedural convention; it is practical necessity. The future-state design needs to account for every step in the current process, and the only way to be confident you have accounted for them all is to have mapped them explicitly. The current-state map is also what you will take into stakeholder conversations to demonstrate that you understand the process before proposing changes to it. Senior stakeholders are understandably sceptical of practitioners who arrive with a solution before they have fully understood the problem. A detailed, accurate current-state map signals that you have done the groundwork.
In this unit, you will produce a current-state map only. The future-state design is the work of Unit 4, once your business case has been developed and your proposed solution has taken shape.
Process mapping and value stream mapping — understanding the difference
So far, everything covered in this lesson relates to process mapping: documenting the steps, decisions, responsibilities, and data flows within a specific process. This is the primary tool you will use in your apprenticeship project. Before you start building your own map, however, it is worth knowing that process mapping is one of two complementary techniques that practitioners use, and understanding the difference helps you choose the right lens for a given situation.
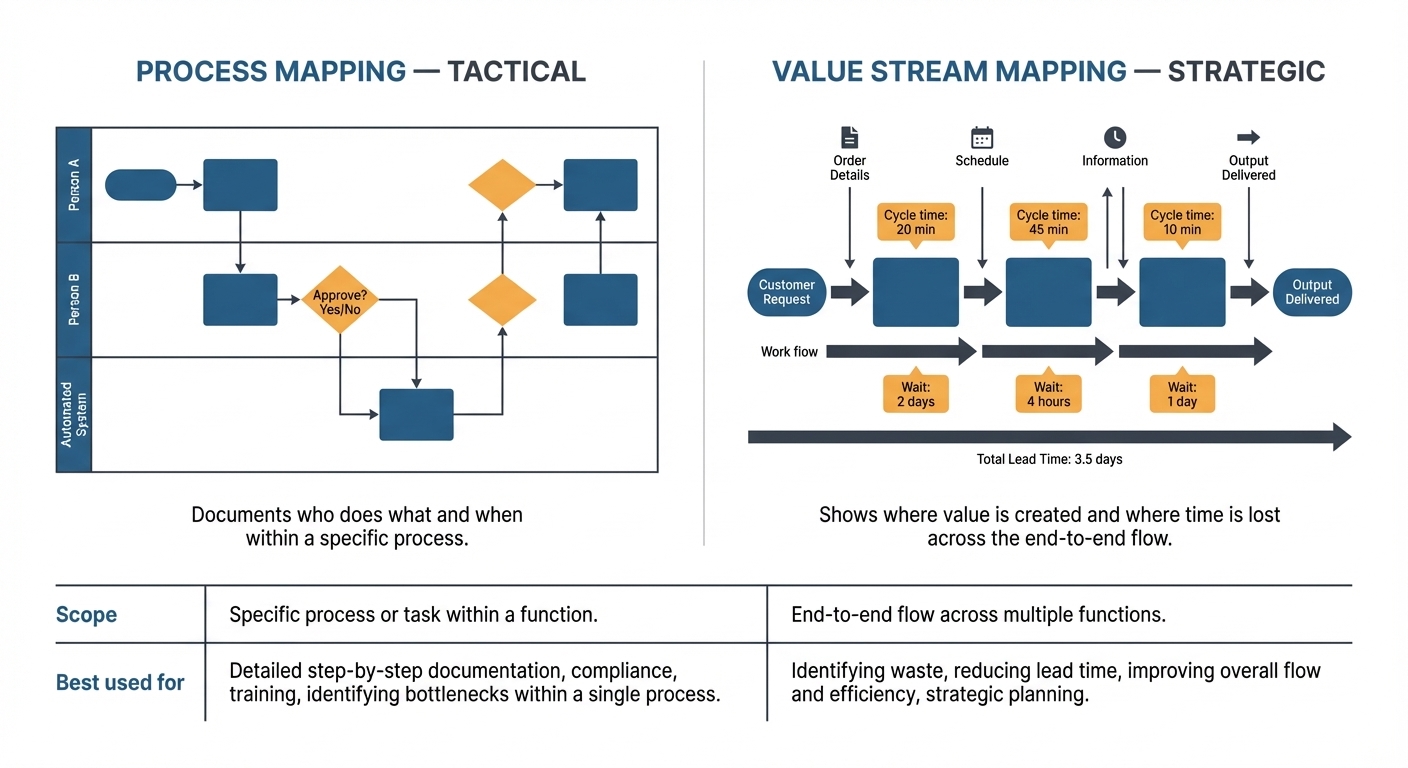
Value Stream Mapping (VSM) originated in lean manufacturing — specifically in the Toyota Production System — and has since been adopted widely across service industries. Where a process map asks "what happens in this process and who does it?", a value stream map asks a different and broader question: across this entire end-to-end flow, where is value actually being created, and where is time and effort being consumed without adding value?
A VSM captures the full journey from the point a request or input enters the system to the point it reaches the customer or end recipient. It includes not just the process steps but the data flows that coordinate them, the waiting time between steps, cycle times for individual activities, and an explicit distinction between steps that add value and steps that are waste. VSM makes the invisible visible: all the queues, delays, handoffs, and rework loops that a standard process map might show as clean sequential steps.
The practical distinction between the two techniques is one of scope and strategic intent. Process mapping is tactical: it documents and clarifies how a specific task or workflow is performed, and it is ideal for identifying the automation opportunity within a process you have already selected. VSM is more strategic: it evaluates the entire value chain to identify where the biggest bottlenecks, delays, and waste exist before deciding where to focus. Organisations use VSM to prioritise improvement and automation work rather than to design the automation itself.
💬 Reflection
Think about the process you have selected as your automation candidate. You have mapped it at the task level — the steps, the decisions, the handovers. Now try to take a step back: where does this process sit in a larger flow? What comes before it, and what happens to the output after it is complete? Are there queues or waiting times between steps that your current-state map might not yet capture?
You do not need to produce a full VSM — that is beyond the scope of this unit. What matters is developing the habit of seeing processes in context, not just in isolation.
A quick reference: when to use each
| Aspect | Process Mapping | Value Stream Mapping |
|---|---|---|
| Scope | A specific process or workflow | End-to-end flow from input to customer |
| Primary question | What are the steps and who does them? | Where is value created and where is waste? |
| Level of detail | Task-level — individual steps and decisions | Stage-level — major activities and time between them |
| Best used for | Documenting, automating, or standardising a process | Identifying bottlenecks and prioritising improvement |
| Time focus | Sequence and dependencies | Cycle time, wait time, and total lead time |
| Common industries | All — services, operations, finance, HR | Lean organisations, manufacturing, high-volume services |
For your apprenticeship project, process mapping is the right tool. VSM becomes relevant if you are working in an organisation that has adopted lean principles, or if you find that your automation candidate sits within a much larger flow that has significant delays or waste outside the specific process you are mapping.
Building your map: five questions for every step
When you sit down to produce your current-state map, the most practical approach is to work through the process step by step, answering five questions for each one. These questions are: who does this step; what information or inputs do they need before they can do it; what do they produce or decide; what does the next step depend on; and are there any exceptions or edge cases at this point that deviate from the standard path?
The answers to these questions give you everything you need to place a step correctly on the map — which swim lane it belongs to, whether it is a process box or a decision diamond, what arrows connect it to neighbouring steps, and what exception paths need to be drawn.
It is also worth identifying, for each step, whether the information involved is digital and accessible or whether it exists in a form — paper, verbal, tacit knowledge — that is not currently usable by an automated system. These are the data readiness notes that will directly inform your feasibility analysis in the Unit 4 business case.
💬 Reflection
Before you start mapping, speak to at least one other person who is involved in the process you have chosen. Their description of the same process will almost certainly contain steps, exceptions, or decision points that you did not know about or had not thought to include. The gap between how a process looks from one person's vantage point and how it actually runs is frequently where the most important design considerations are found.
Mapping tools — choosing what works for you
You do not need specialist software to produce a workflow map, and the tool you use matters far less than the quality of your thinking. That said, the right tool makes the process noticeably faster — particularly when you need to share your map with colleagues or revise it based on feedback. Below is an overview of the main options available, from free and accessible to enterprise-level. It is not necessary to try all the tools below, pick one that suits your organisation or your style to focus on!
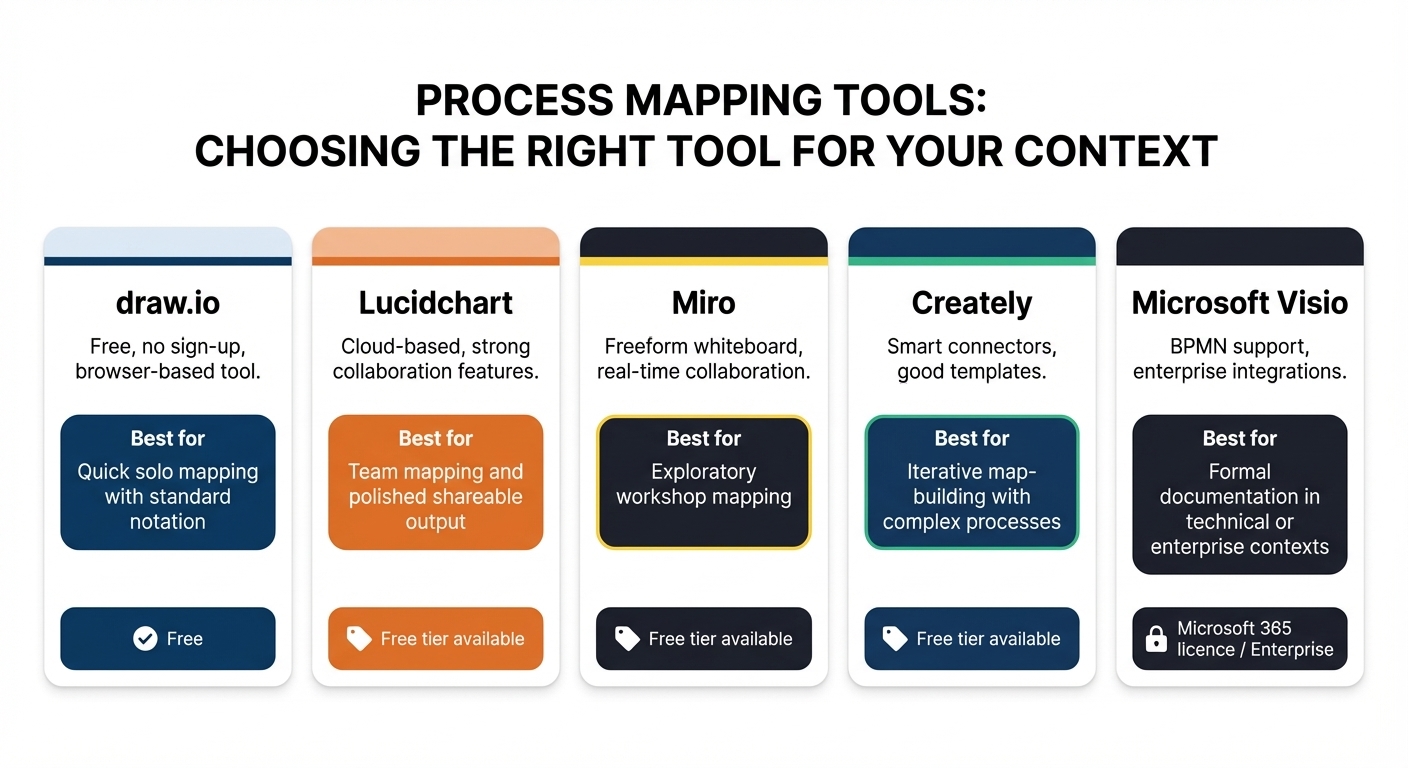
Draw.io (diagrams.net)
Draw.io is a free, browser-based diagramming tool that requires no account or installation. It supports all standard workflow notation — process boxes, decision diamonds, swim lanes, arrows — and has ready-made templates for flowcharts and process maps. For learners producing a clean, correctly notated map without a steep learning curve, draw.io is typically the first recommendation. Navigate to diagrams.net in any browser and you can be building your first map within minutes.
Lucidchart
Lucidchart is a cloud-based diagramming platform with a more polished interface than draw.io and stronger real-time collaboration features. A free tier is available with some limitations on the number of objects per diagram; many organisations have existing licences as part of their productivity tooling. Lucidchart is particularly useful when you are working on a map with colleagues simultaneously, or when the finished diagram needs to be embedded in reports or documentation.
Miro
Miro is a collaborative online whiteboard. Unlike draw.io and Lucidchart, which are purpose-built diagramming tools, Miro gives you a freeform canvas where you can sketch, annotate, add sticky notes, and build a map iteratively. It is particularly well-suited to early-stage, exploratory mapping — the kind of work you do when you are first figuring out a process with colleagues in a workshop setting, before you need a formally notated diagram. Miro has process mapping templates built in, and its flexibility makes it much easier to sketch rough versions and reorganise them before committing to a clean format.
Creately
Creately is a diagramming and visual workspace tool that sits between Miro and Lucidchart in terms of formality. It has strong support for standard flowchart and swim-lane notation, a solid template library, and real-time collaboration. Its standout capability is intelligent shape behaviour: connecting shapes automatically snaps correctly, and moving a step repositions its connectors without manual adjustment. This makes it noticeably faster to build and revise complex maps with many steps and branches.
Microsoft Visio
Microsoft Visio is the enterprise-grade diagramming tool in the Microsoft 365 ecosystem. Unlike the other tools in this list, the licensed version of Visio is built for complex, professional-grade diagrams that go well beyond process mapping — from network topology and infrastructure diagrams to engineering schematics and IT architecture models. It supports BPMN (Business Process Model and Notation, pronounced "bip-em-en"), the internationally recognised notation standard used when process documentation needs to meet formal technical or regulatory requirements. It also integrates seamlessly with SharePoint, which makes it the natural choice in organisations where technical diagrams need to be stored, versioned, and shared within Microsoft's ecosystem.
The trade-off is licensing cost and complexity. Visio requires a paid licence — either a standalone subscription or inclusion in a higher-tier Microsoft 365 plan — and it has a steeper learning curve than the other tools listed here. If your organisation already has Visio licences available, it is worth knowing it exists; if it does not, the cost is unlikely to be justified for the current-state map you are producing in Activity 3. For most learners at this stage, one of the free or lower-cost tools will serve you well. Visio becomes relevant when you are working with IT or engineering teams that use it as their documentation standard, or when your organisation's process documentation needs to integrate with enterprise architecture tooling.
Fun Fact: Did you know that the origins of workflow mapping go back over 100 years? Early forms of process mapping were developed in the early 1900s during the industrial engineering movement, where pioneers like Frank and Lillian Gilbreth used process diagrams to analyse factory work and eliminate wasted effort. Today, the same core idea is still used — but now AI can help generate the first draft of those workflows in seconds.
One of the most practical applications of AI tools in this unit is using them to accelerate the initial draft of your workflow map — not as a replacement for the thinking work, but as a way to move faster from a rough description to a structured starting point that you can then refine.
Several tools now support AI-assisted diagramming directly. Both Lucidchart and Creately have AI features that can generate a draft process map from a text description. You describe the process in plain language — the trigger, the main steps, the decision points, and the actors involved — and the tool produces an initial diagram that you then edit, correct, and extend. This is particularly useful for getting a visual skeleton onto the canvas quickly, especially if you find it easier to start from something and refine it than to build from a blank page.
You can also use a general-purpose AI assistant — such as Claude, Microsoft Copilot, or ChatGPT — to help you think through the structure of a process before you open your mapping tool. Prompt it with a description of your process and ask it to identify the likely steps, decision points, swim lane participants, and exception paths. The output will not be perfectly accurate — the AI does not know your organisation — but it can surface structural questions you had not considered and give you a more complete starting point for your own mapping work.
A useful prompt structure for this task is: "I am mapping a current-state workflow for [process name] in my organisation. The process involves [brief description of what happens]. The main people and systems involved are [list them]. Can you help me identify the likely steps, decision points, and exception paths I should include in my process map?" Take the AI's output as a draft checklist to validate against reality, not as a finished map.
The important boundary to maintain is that the AI can help you structure your thinking and produce a first draft, but the accuracy of the current-state map is your professional responsibility. A map that reflects the AI's assumptions rather than your organisation's reality is worse than useless — it will lead to design decisions in Unit 4 that are based on a process that does not exist. Every element that appears on your submitted map must be something you have verified against what actually happens.
Below is a video introducing how to use Lucidchart with its embedded AI function to create a flow diagram!
📝 Activity 2 — Apply the Suitability Framework
Complete before your coaching session | Estimated time: 90 minutes
Take the longlist you built in Activity 1 and select your three most promising candidates. Apply the five-dimension framework to each one in your Unit 3 Workbook. For every dimension, record your score (High, Medium, or Low) and write at least two to three sentences of specific rationale. Refer back to the strong and weak rationale examples in Lesson 2.
When you have scored all three candidates, write a short paragraph — four to six sentences — identifying which candidate you intend to take forward for workflow mapping and why. Your reasoning should draw directly on the dimension scores, not just on gut instinct.
📝 Activity 3 — First-pass workflow map
Complete and share with your coach at least 24 hours before your coaching session | Estimated time: 60 minutes
Select your highest-scoring candidate process and produce a current-state workflow map. Your map must include all of the following:
- The trigger — what starts the process
- All steps in sequence, using process boxes with active verb labels
- At least one decision point, shown as a decision diamond with labelled exit paths
- Swim lanes showing who or what is responsible for each step — include any systems or automated components as their own swim lane if relevant
- Notes on what data or documents are involved at each step
- The end output — what constitutes completion of the process
Start with a rough sketch on paper, then transfer to a digital tool. Draw.io is a good free default if you are unsure which tool to use. You may use an AI assistant to help structure your thinking or generate a first draft, but every element on the submitted map must reflect how the process actually works in your organisation. Share your map with your skills coach at least 24 hours before your coaching session, along with a brief written note describing any steps or data issues you found difficult to map precisely and why.
Unit 3 — Complete
You have now applied the automation lens to your own workplace, evaluated your candidate processes against a structured framework, and produced a current-state workflow map of your most promising candidate. The analytical work you have done in this unit is the direct foundation for your Unit 4 business case.
What you can now demonstrate
By completing this unit, you have worked towards the following Knowledge, Skills and Behaviours:
| KSB | Description | Where it appears in this unit |
|---|---|---|
| K5 | Methods to identify opportunities to enhance productivity — improving processes, reducing waste, increasing satisfaction, optimising outcomes | Lessons 1 and 2 — the automation lens, suitability categories, the five-dimension framework; Activity 1 longlist |
| K9 | AI and automation concepts, models and limitations. The impact adoption may have on workplace culture and wellbeing | Lesson 1 — what is and is not suited to automation; the broken process warning |
| S6 | Review and complete workflow and process mapping to identify problems or inefficiencies and recommend solutions | Lesson 3 — workflow notation, current vs future state, process mapping vs VSM, mapping tools, AI-assisted mapping; Activity 3 |
| S13 | Identify opportunities to deliver automation. Support leaders in integrating ethical, empathetic approaches when decision-making | Lesson 2 — Dimension 5 (strategic value and feasibility); Lesson 1 — categories unsuited to automation |
| S14 | Support in the identification and evaluation of opportunities for increased productivity, including low/no-code tools and AI platforms | Lessons 1 and 2 — the suitability framework; Activities 1 and 2 |
Your coaching session checklist
Before your session, make sure you have:
- ✅ Completed Activity 1 — Process longlist (at least eight to ten processes) with initial instincts noted
- ✅ Completed Activity 2 — Suitability Framework applied to your top three candidates, with written rationale for every dimension score
- ✅ Completed Activity 3 — Current-state workflow map shared with your coach at least 24 hours before your session
- ✅ Written a short note on any mapping challenges, data gaps, or AI-assisted drafting steps you encountered
Your coach will use your longlist, your scored assessments, and your workflow map to help you select and refine the candidate process that will form the basis of your Unit 4 business case.
Level 4 AI & Automation Practitioner | Unit 3 — Lesson 3 of 3 | Version 1.0